This monitoring tool provides a visual display of various performance metrics for node runtime, helping you understand node performance, debug, tune, and gain insight into actual Node runtime.
Here's how to deploy the monitoring tool:
Installing InfluxDB 1.8 and Grafana on Linux System
1. Update the System
Before starting the installation, first update the package manager of the system:
sudo apt update && sudo apt upgrade -y
2. Download and Install InfluxDB 1.8
Go to the InfluxData official repository and download the suitable version of InfluxDB 1.8 for your system. For Debian/Ubuntu systems, you can use the following commands:
wget https://dl.influxdata.com/influxdb/releases/influxdb_1.8.10_amd64.deb
sudo dpkg -i influxdb_1.8.10_amd64.deb
Start InfluxDB
Start the InfluxDB service and set it to start on boot:
sudo systemctl start influxdb
sudo systemctl enable influxdb
Check Service Status
You can check the status of the InfluxDB service with the following command:
sudo systemctl status influxdb
If you see active (running), it means the service is working fine.
After saving, restart the service:
sudo systemctl restart influxdb
and confirm that InfluxDB is listening on the port:
sudo lsof -i :8086
Create User and Database
You can use the following commands to create a user(user01,with password 12345678),it will serve for high level management, creating databases and users.Then enter the influxdb command line interface to create a database(xdc)and a user(xdc)with password xdc.
curl -XPOST "http://localhost:8086/query" --data-urlencode "q=CREATE USER user01 WITH PASSWORD '12345678' WITH ALL PRIVILEGES"
influx -username 'user01' -password '12345678'
create database xdc
CREATE USER xdc WITH PASSWORD 'xdc'
Use the following commands to verify the created entries:
show databases
show users
3. Prepare Node
Download and configure xdpos, ensuring the folder settings are correct. Modify the startup script to add the following commands:
    --metrics \
    --metrics-influxdb \
    --metrics-influxdb.database "xdc" \
    --metrics-influxdb.username "xdc" \
    --metrics-influxdb.password "xdc" \
    --metrics-influxdb.endpoint "http://localhost:8086" \
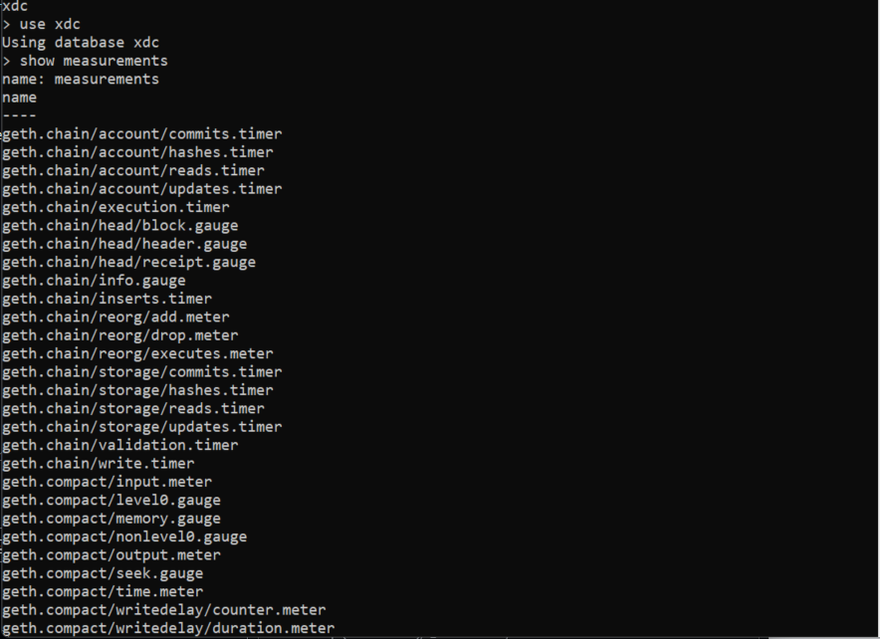
start the node and check if the data is being pushed:
influx -username 'user01' -password '12345678'
use xdc
show measurements
Firewall Settings
If the firewall blocks access to port 8086, run the following command to check the status:
sudo ufw status
If the firewall is on and port 8086 is not allowed, run the following commands to open the port:
sudo ufw allow 8086
sudo ufw reload
4. Set Up Grafana
Install Grafana:
curl -tlsv1.3 --proto =https -sL https://packages.grafana.com/gpg.key | sudo apt-key add -
echo "deb https://packages.grafana.com/oss/deb stable main" | sudo tee -a /etc/apt/sources.list.d/grafana.list
sudo apt update
sudo apt install grafana -y
sudo systemctl enable grafana-server
sudo systemctl start grafana-server
Check Grafana Status
Confirm if the Grafana service is running properly:
lsof -i :3000
Access the Grafana interface in your browser:
http://localhost:3000/
Configure InfluxDB Data Source
In Grafana, click on the "Data Sources" icon and select "InfluxDB". It is recommended to use the following configuration options:
- Name: InfluxDB
- Query Language: InfluxQL
-
HTTP
- URL: http://localhost:8086
- Access: Server (default)
- Whitelisted cookies: None (leave blank)
- Auth: All options left as their default
-
InfluxDB Details
- Database:
- User:
- Password:
- HTTP Method: GET
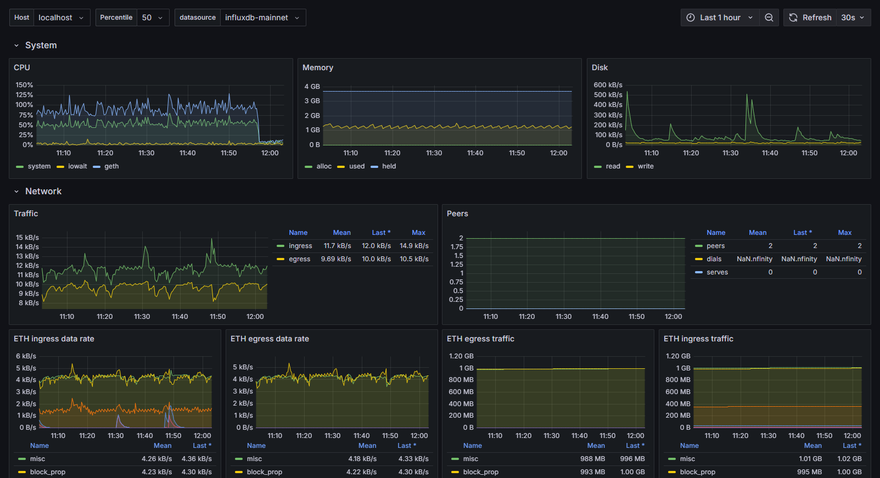
Click on "Save and test" and wait for the confirmation to pop up,then you can follow the instruction to create a dashboard ,add panels and configure the dashboard.here is a often used example dashboard:
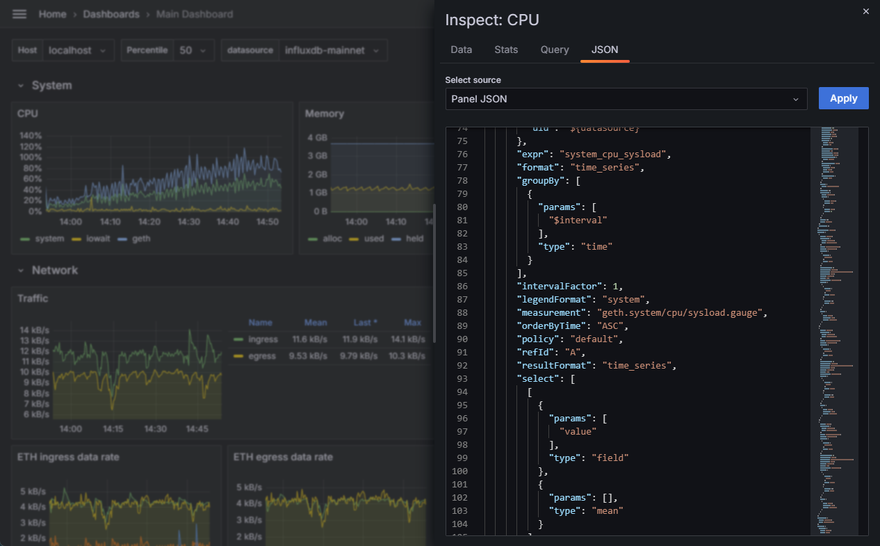
you can also create your own panel and dashboard to meet your needs,and adjust the parameters on Inspect>Penal JSON.
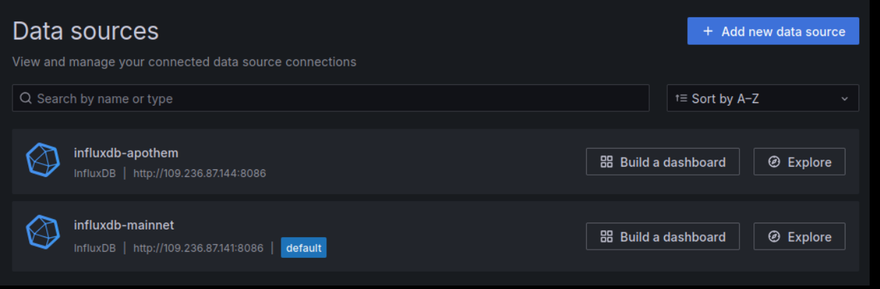
Configuring Multiple Data Sources
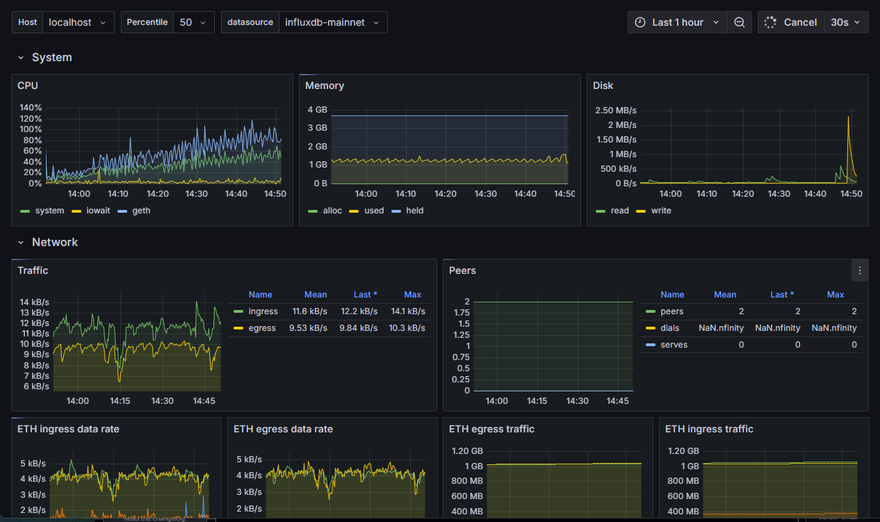
If you want to monitor the performance of multiple nodes at the same time, you can use the same steps to push data to the monitoring system. This means different nodes or services can send their performance metrics independently, allowing for centralized monitoring and data analysis. See the image below:
If you need to set up multiple data sources to view in the same dashboard, you can create a new variable in the dashboard to query the corresponding data.
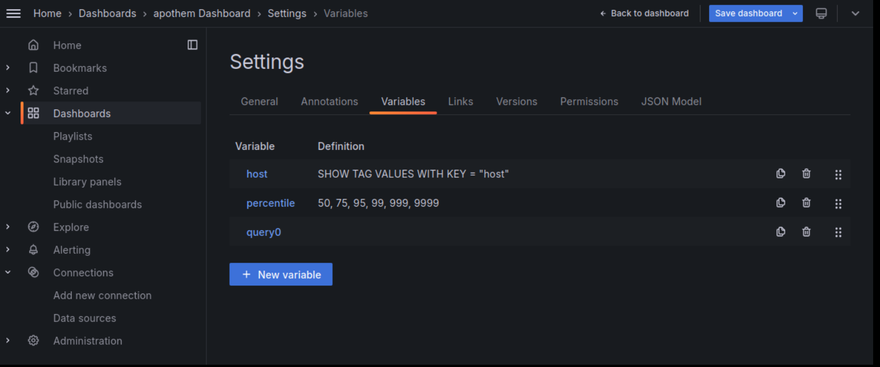
To learn more about how dashboards work, refer to Grafana's documentation.


Discussion (1)
Setting up monitoring tools like InfluxDB and Grafana really helps in keeping track of node performance. The instructions are clear and easy to follow—looking forward to applying these steps myself! Still a newbie though.
Best,
Clément
Madrid - Spain